
Thailand is one of the world’s most popular tourist destinations and, like many global tourism hotspots, was severely affected by the Covid-19 pandemic. This comprehensive list of statistics about tourism in Thailand provides insight into this key driver of the Thai economy. How has the tourism industry in Thailand recovered as global travel restrictions have been curtailed? What are the key historical tourism stats in Thailand? On this page you’ll find all the key stats you need to know about tourism in Thailand.
Here’s a breakdown of the statistics you’ll find here:
- Thailand Tourism Statistics (top stats)
- How many tourists visit Thailand each year?
- How many tourists visit Thailand now? How many are expected to visit in 2022?
- What nationality visits Thailand the most?
- Which region of the world do most visitors to Thailand come from?
- Which European nationalities visit Thailand the most?
- How many US citizens visit Thailand?
- How much does the average tourist spend per capita in Thailand?
- Which foreign visitors spend the most per capita in Thailand?
- Which foreign visitors spend the least per capita?
- How much time do people spend in Thailand (average trip length)
- What is the average occupancy rate of accommodation?
- How many jobs do travel and tourism contribute to the Thai economy?
- How much does Tourism contribute to the GDP of Thailand?
- What is the busiest month for Tourism in Thailand?
Thailand tourism statistics (top stats)
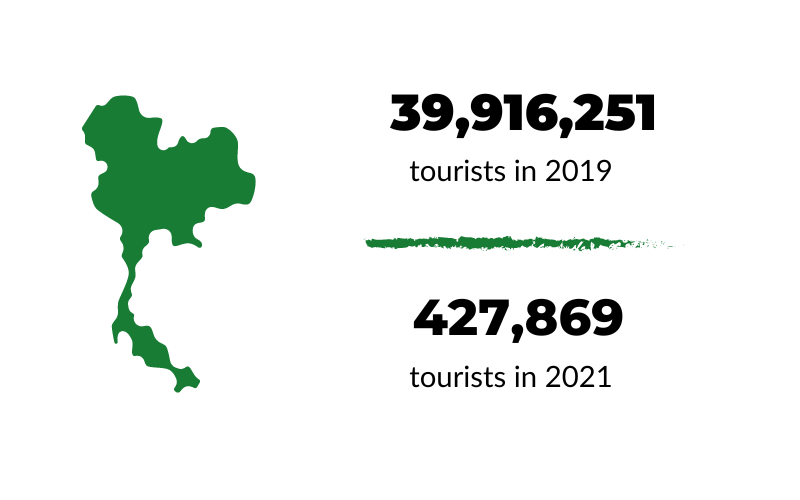
- Prior to the Covid 19 pandemic Thailand received a record number of visitors, 39,916,250 in 2019. In 2021, that number fell to 427,869.
- In 2019, Thailand received 11,138,658 visitors from China. In the first 8 months of 2022, only 114,596 Chinese tourists visited Thailand.
- Thailand expects to receive a total of 10 million foreign tourists in 2022 and has already received 4,378,920 for the period of January through August of 2022.
- In 2022, citizens of the United Kingdom made up 19.8% of European visitors representing the largest cohort of visitors from Europe.
- In 2019, 1.48 million Russian tourists visited Thailand which represented the largest portion of European visitors at 22.7% percent. In 2022 only 87,485 Russian visitors arrived in Thailand representing 8.5% of the total visitors from Europe.
- The average per capita visitor spend per day is 5,172 Baht or $167 USD per day as of 2019.
- The average tourist visits Thailand for just over 9 days.
- December is historically the busiest month for foreign tourism in Thailand. In December of 2019, Thailand received over 3.947 million visitors.
- In 2020, the tourism industry contributed around 883 billion Thai baht to Thailand’s GDP or approximately 5.67% of GDP
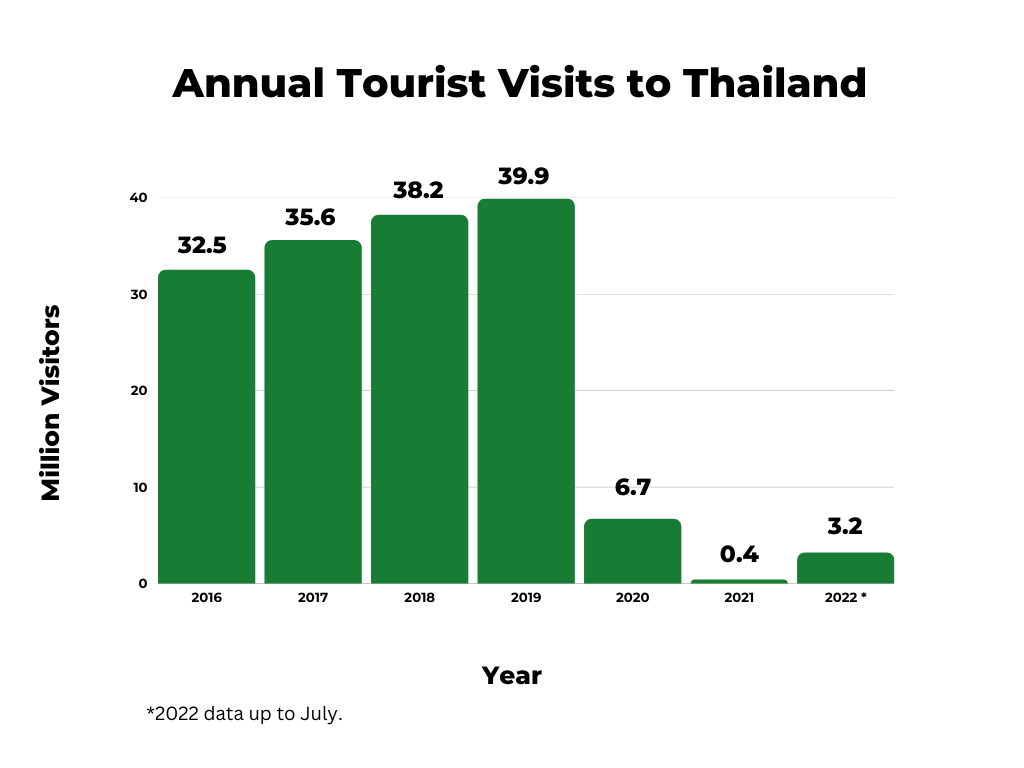
How many tourists visit Thailand each year?
In 2019, prior to the Covid-19 pandemic 39.9 million foreign tourists visited Thailand. This was a record number of tourists for one year.
How many tourists visit Thailand now?
How many are expected to visit in 2022?
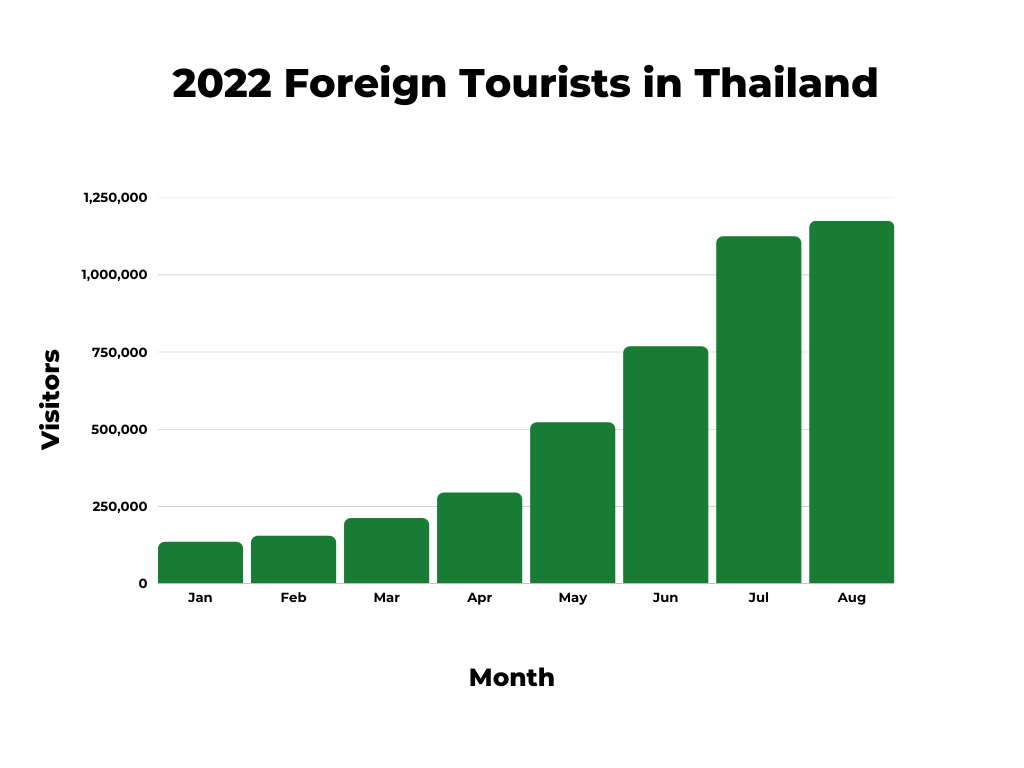
Tourism numbers have increased through 2022 as travel restrictions have been curtailed with Thailand receiving a total 4,378,920 foreign visitors through the end of August, 2022. This number already drastically exceeds the 427,869 foreign visitors that arrived through all of 2021. The Thai government expects 1.5 million arrivals each month in the last quarter of 2022 and 10 million visitors for the complete 2022 calendar year.
| Foreign Visitors to Thailand 2022 | |
| Month | # of Visitors |
| Jan | 133,900 |
| Feb | 152,950 |
| Mar | 210,840 |
| Apr | 293,350 |
| May | 521,410 |
| Jun | 767,500 |
| Jul | 1,124,230 |
| Aug | 1,174,740 |
What nationality visits Thailand the most?
As of 2022 visitors from Malaysia, India and Singapore make up the top 3 nationalities visiting Thailand. Prior to the pandemic the top 3 positions were occupied by China, Malaysia, and India. The biggest change was China falling from a 27.9% share of visitors to Thailand in 2019 to 2.6% in 2022 as the number of visitors from China traveling to Thailand fell drastically from its’ pre-pandemic peak of 11,138,657.
| Visitors by Nationality 2019 | |||
| Rank | Country | Visitors | % Share |
| 1 | China | 11,138,658 | 27.9% |
| 2 | Malaysia | 4,274,458 | 10.7% |
| 3 | India | 1,961,069 | 4.9% |
| 4 | Korea | 1,880,465 | 4.7% |
| 5 | Laos | 1,856,762 | 4.7% |
| 6 | Japan | 1,787,185 | 4.5% |
| 7 | Russia | 1,481,837 | 3.7% |
| 8 | Singapore | 1,150,024 | 2.9% |
| 9 | USA | 1,136,210 | 2.8% |
| 10 | Hong Kong | 1,090,121 | 2.7% |
| 11 | Vietnam | 1,080,609 | 2.7% |
| 12 | UK | 946,774 | 2.4% |
| 13 | Cambodia | 925,437 | 2.3% |
| 14 | Germany | 836,926 | 2.1% |
| 15 | Taiwan | 781,674 | 2.0% |
| 16 | Australia | 771,798 | 1.9% |
| 17 | France | 713,405 | 1.8% |
| 18 | Indonesia | 706,908 | 1.8% |
| 19 | Philippines | 473,565 | 1.2% |
| 20 | Myanmar | 389,301 | 1.0% |
| Top 20 Visitors by Nationality 2022* | |||
| Rank | Country | Visitors | % Share |
| 1 | Malaysia | 642,351 | 14.7% |
| 2 | India | 455,765 | 10.4% |
| 3 | Singapore | 243,835 | 5.6% |
| 4 | Vietnam | 204,883 | 4.7% |
| 5 | United Kingdom | 204,231 | 4.7% |
| 6 | USA | 187,205 | 4.3% |
| 7 | Korea | 184,463 | 4.2% |
| 8 | Laos | 175,227 | 4.0% |
| 9 | Germany | 157,295 | 3.6% |
| 10 | Cambodia | 153,943 | 3.5% |
| 11 | Australia | 148,886 | 3.4% |
| 12 | France | 131,625 | 3.0% |
| 13 | Japan | 116,841 | 2.7% |
| 14 | China | 114,596 | 2.6% |
| 15 | Russia | 87,485 | 2.0% |
| 16 | Myanmar | 80,847 | 1.8% |
| 17 | Indonesia | 72,628 | 1.7% |
| 18 | Israel | 67,244 | 1.5% |
| 19 | Philippines | 62,448 | 1.4% |
| 20 | Saudi Arabia | 59,526 | 1.4% |
| *2022 (Jan-August) | |||
What region of the world do most visitors to Thailand come from?
In 2022, the majority of international visitors to Thailand came from Eastern Asia, 2,110,234, followed by Europe, 1,030,003. The overall percentage of visitors from Eastern Asia fell significantly, with the decline in Chinese tourists.
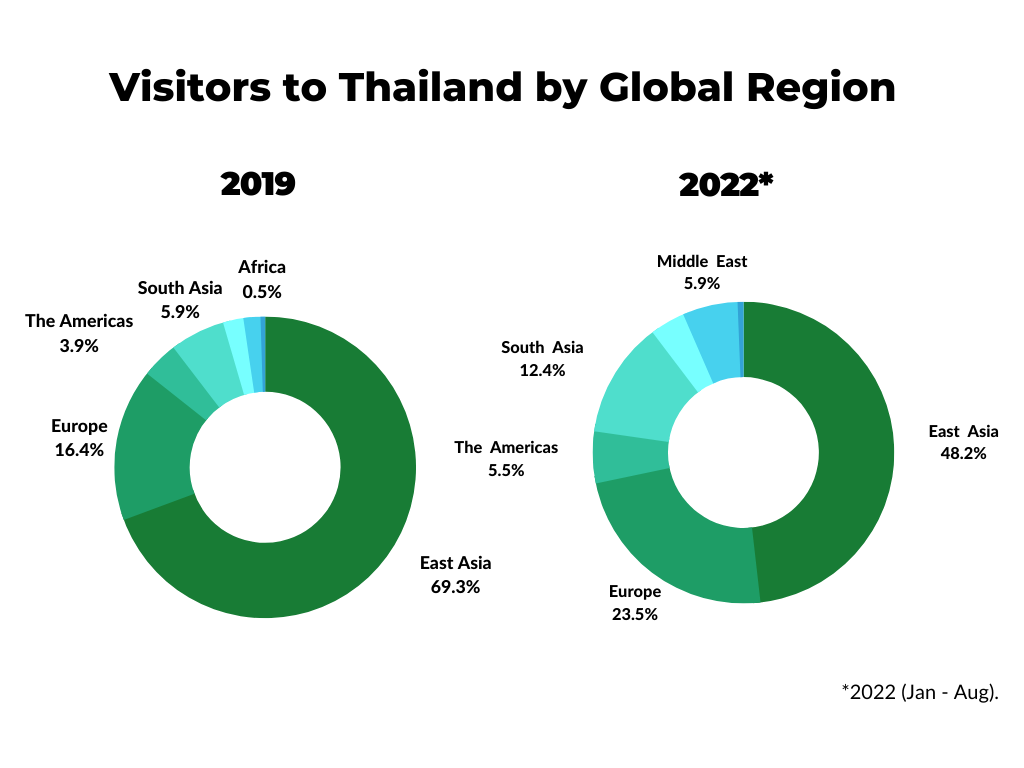
Here is a detailed breakdown of visitors to Thailand by global region or origin:
| 2019 Visitors by Region | ||
| Region | Visitors | % Share |
| East Asia | 27,669,963 | 69.30% |
| Europe | 6,531,220 | 16.40% |
| South Asia | 2,356,977 | 5.90% |
| Americas | 1,559,800 | 3.90% |
| Oceania | 874,154 | 2.20% |
| Middle East | 727,318 | 1.80% |
| Africa | 196,819 | 0.50% |
| Total | 39,916,251 | 100% |
| 2022 Visitors by Region (Jan – Aug) | ||
| Region | Visitors | % Share |
| East Asia | 2,110,234 | 48.20% |
| Europe | 1,030,003 | 23.50% |
| South Asia | 544,775 | 12.40% |
| Middle East | 259,207 | 5.90% |
| Americas | 242,756 | 5.50% |
| Oceania | 164,659 | 3.80% |
| Africa | 27,286 | 0.60% |
| Total | 4,378,920 | 100% |
Which European nationalities visit Thailand the most?
For the year-to-date 2022, visitors from the United Kingdom represented the largest portion of European visitors to Thailand with 204,231. Historically, Russian visitors were the largest cohort of European travelers to Thailand, representing 23% of 2019 foreign European visitors.
| European Visitors to Thailand | ||||
| Country | 2022* Visitors | % share (22) | 2019 Visitors | % share (19) |
| United Kingdom | 204,231 | 19.80% | 946,774 | 14.50% |
| Germany | 157,295 | 15.30% | 836,926 | 12.80% |
| France | 131,625 | 12.80% | 713,405 | 10.90% |
| Russia | 87,485 | 8.50% | 1,481,837 | 22.70% |
| Eastern Europe | 84,929 | 8.20% | 532,911 | 8.20% |
| Netherlands | 59,056 | 5.70% | 230,006 | 3.50% |
| Other | 43,764 | 4.20% | 225,753 | 3.50% |
| Spain | 43,248 | 4.20% | 186,969 | 2.90% |
| Italy | 37,809 | 3.70% | 250,870 | 3.80% |
| Sweden | 36,042 | 3.50% | 279,451 | 4.30% |
| Switzerland | 33,945 | 3.30% | 206,087 | 3.20% |
| Denmark | 32,199 | 3.10% | 159,526 | 2.40% |
| Belgium | 24,068 | 2.30% | 114,016 | 1.70% |
| Norway | 22,089 | 2.10% | 130,509 | 2.00% |
| Austria | 18,190 | 1.80% | 110,690 | 1.70% |
| Finland | 14,028 | 1.40% | 125,490 | 1.90% |
| Total | 1,030,003 | 100.00% | 6,531,220 | 100.00% |
How many US citizens visit Thailand?
In 2022 (Jan- August), 187,205 US citizens visited Thailand. In 2019, 1,136,21 US citizens visited.
How much do tourists spend in Thailand per Capita?
In 2019, the per capita spend per foreign visitor to Thailand was 5,172 Baht or $167 USD per day.
Which foreign tourists spend the most per Capita in Thailand?
In 2019, visitors from Kuwait spent the most spending a per capita amount of $224.16 USD per day.
Which foreign tourists spend the least per capita in Thailand?
In 2019, visitors from France spent the least per capita amount of $112.02 USD per day.
Here’s the complete breakdown of per capita spends by tourists visiting Thailand:
| Per Capita Spend/Day in Thailand by Country of Residence (2019) | ||
| Country of Residence | $US/Day | |
| Kuwait | $224 | |
| Egypt | $222 | |
| U.A.E. | $220 | |
| Saudi Arabia | $220 | |
| Brunei | $217 | |
| Hong Kong | $208 | |
| Singapore | $199 | |
| China | $197 | |
| Bangladesh | $187 | |
| Myanmar | $186 | |
| Cambodia | $185 | |
| Pakistan | $185 | |
| Sri Lanka | $180 | |
| Korea | $179 | |
| Africa | $178 | |
| Laos | $177 | |
| India | $177 | |
| Australia | $174 | |
| Japan | $173 | |
| Norway | $170 | |
| Malaysia | $168 | |
| Taiwan | $168 | |
| Israel | $167 | |
| Nepal | $166 | |
| Denmark | $163 | |
| New Zealand | $163 | |
| Brazil | $161 | |
| South Africa | $158 | |
| Vietnam | $156 | |
| Philippines | $154 | |
| USA | $153 | |
| Finland | $149 | |
| Indonesia | $147 | |
| Argentina | $146 | |
| Switzerland | $144 | |
| Sweden | $143 | |
| Austria | $138 | |
| United Kingdom | $138 | |
| East Europe | $137 | |
| Canada | $132 | |
| Russia | $132 | |
| Netherlands | $131 | |
| Spain | $129 | |
| Italy | $126 | |
| Belgium | $123 | |
| Germany | $116 | |
| France | $112 | |
How long does the average traveler spend in Thailand?
The average visitor spends just over 9 days in Thailand.
Which nationality spends the longest amount of time in Thailand?
Tourists from Sweden typically spend the longest amount of time in Thailand with an average stay in 2019 of 19 days.
Which nationality spends the shortest amount of time in Thailand?
Tourists from Malaysia typically spend the shortest amount of time in Thailand with an average stay of just under 5 days.
Here’s a complete breakdown of the average trip duration to Thailand:
| Duration of Stay | |
| Country | Average Stay (Days) |
| Sweden | 19.15 |
| United Kingdom | 17.83 |
| Netherlands | 17.42 |
| Norway | 17.40 |
| Germany | 17.37 |
| France | 17.26 |
| Switzerland | 17.23 |
| Denmark | 17.04 |
| Canada | 17.02 |
| Finland | 16.99 |
| Russia | 16.94 |
| Belgium | 16.80 |
| Austria | 16.55 |
| Israel | 15.96 |
| Italy | 15.09 |
| Spain | 14.89 |
| USA | 14.19 |
| Argentina | 14.07 |
| Australia | 13.29 |
| Kuwait | 13.05 |
| South Africa | 13.01 |
| Saudi Arabia | 12.83 |
| New Zealand | 12.58 |
| Brazil | 12.49 |
| Egypt | 11.31 |
| U.A.E. | 11.14 |
| Pakistan | 10.71 |
| Japan | 9.79 |
| Nepal | 9.52 |
| Philippines | 8.74 |
| Bangladesh | 8.32 |
| Taiwan | 8.24 |
| China | 7.80 |
| Vietnam | 7.59 |
| India | 7.43 |
| Cambodia | 7.39 |
| Korea | 7.20 |
| Sri Lanka | 7.16 |
| Brunei | 7.06 |
| Myanmar | 6.73 |
| Singapore | 6.14 |
| Hong Kong | 6.10 |
| Laos | 5.68 |
| Indonesia | 5.68 |
| Malaysia | 4.81 |
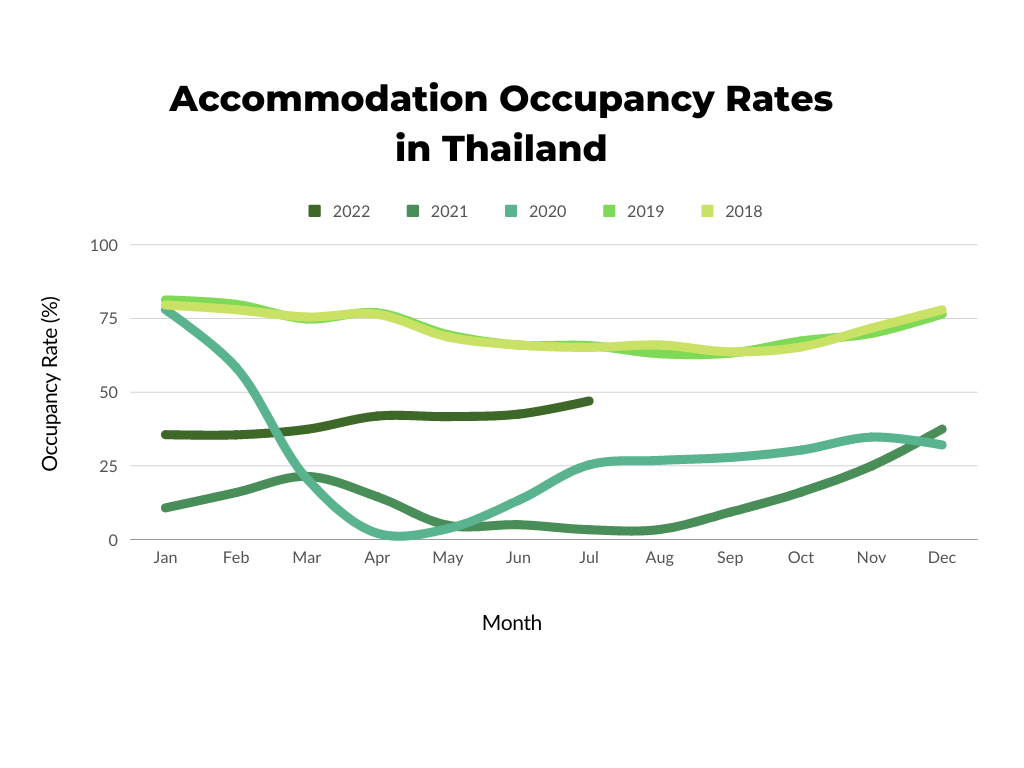
What is the average occupancy rate of tourist accommodation in Thailand?
Tourist accommodation occupancy in Thailand has increased to 47% as of July 2022 up from a Covid era low of 2.2% set in April of 2020, but well off the 2019 annual average of 71.3%.
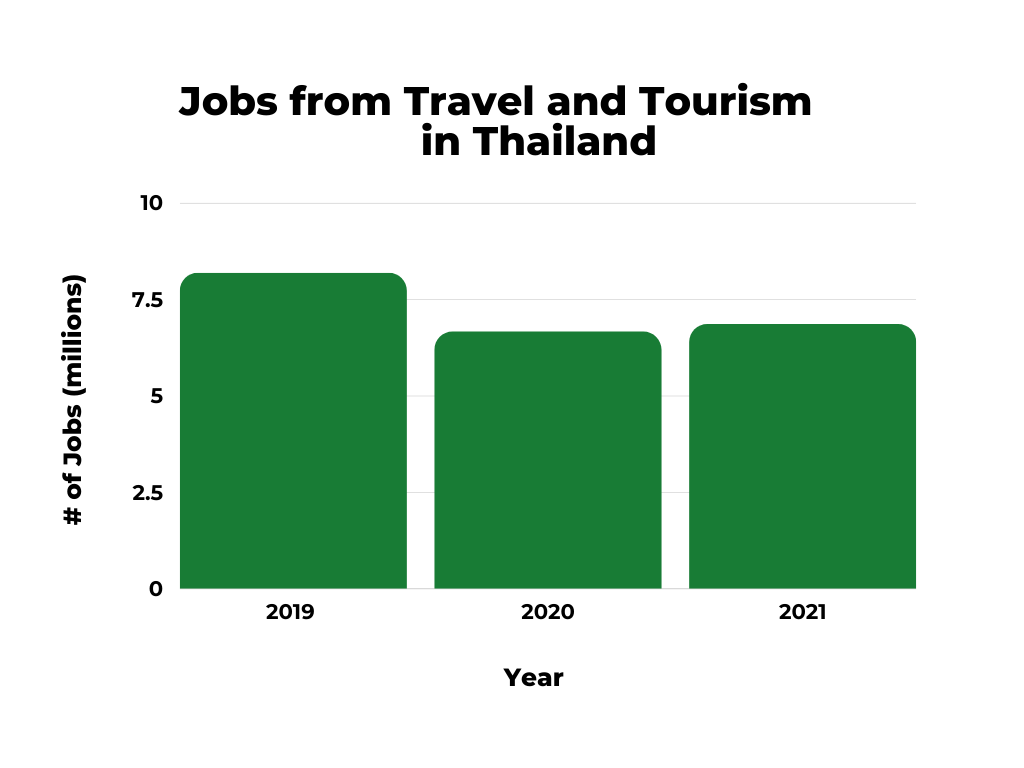
How many jobs do travel and tourism contribute to the economy in Thailand?
In 2021, the travel and tourism industry contributed an estimated 6.86 million jobs to the economy in Thailand. This was a sharp reduction from the 8.19 million jobs the sector contributed in 2019.
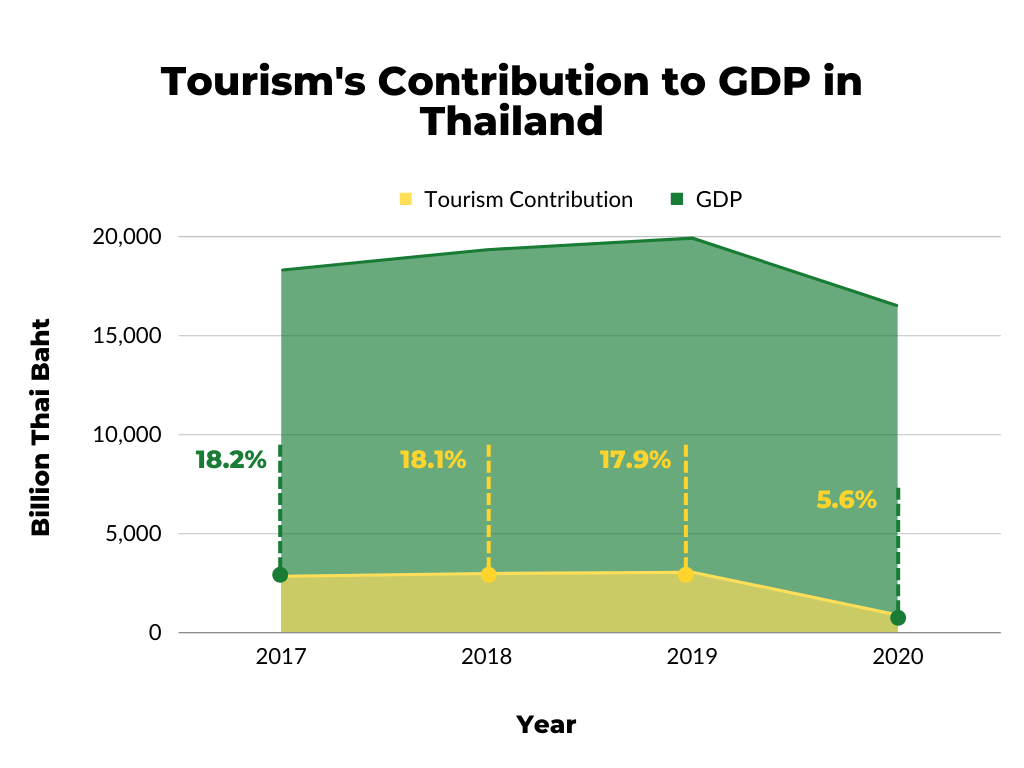
How much does Tourism contribute to Thailand's GDP?
In 2020, the tourism industry contributed around 883 billion Thai baht which was 5.65% of the country’s GDP. This was a sharp drop from 2019, when Tourism contributed 3,029 billion Thai baht and 17.9% of GDP.
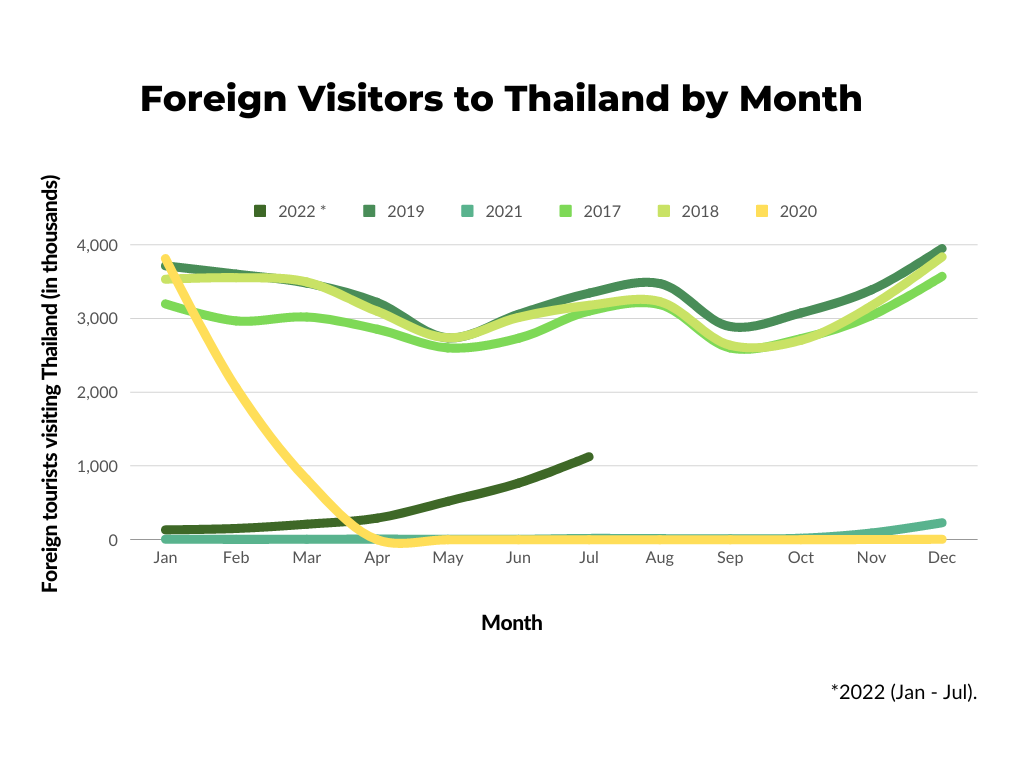
What is the busiest month for Tourism in Thailand?
Historically, December is the busiest month for tourism in Thailand with the largest number of foreign tourists visiting. In December of 2019, Thailand received over 3.947 million visitors. During the post-pandemic years 2020 and 2021, just over 6.500 and 230,000 foreign tourists came to Thailand in December.
Here’s a closer look at the pre and post pandemic foreign tourist numbers by month:
Conclusion
There you have it, a breakdown of the major travel and tourism statistics for Thailand. Thailand’s tourism industry appears to be rebounding from the nadir of the early stages of the Covid-19 pandemic, but it remains to be seen when numbers will meet or exceed the records recorded in 2019.
Data sources : Thailand Ministry of Tourism & Sports , The World Bank, Bank of Thailand
Planning a trip to Thailand? Don't forget this.
Emergency medical situations can and do happen. Don’t forget your travel insurance! I went years without making a claim on travel insurance until a suffered a broken collarbone and racked up medical bills in excess of $15, 000. Fortunately, I had travel insurance!
World Nomads is the best choice for traveling in Thailand with comprehensive coverage for medical, luggage & gear and trip cancellation. Hopefully you never need to make a claim, but if you do you’ll be beyond happy you were prepared!
Disclaimer: Some of the links in this post may be affiliate links. If you click one of the links and make a purchase we’ll earn a small commission at no cost to you. Just like the travel backpacks we build, we’re very particular . So any products or services we suggest, we test and use ourselves before making any recommendations or endorsements.

Michael